
Analyst Benjamin Cowen compared Bitcoin's current price to its level in June/July 2018, indicating "simulation confirmed" as Bitcoin traded around $60,326.
- CryptoQuant CEO Ki Young Ju reported a collapse in Bitcoin's capital efficiency, with current cycles needing $101.1 billion in net inflows to double the price.
- 10x Research analyzed its Elliott Wave count and found that it indicates a decline in Bitcoin toward $50,000.
- Ecoinometrics noted significant Bitcoin ETF outflows in June, marking their largest since launch.
Bitcoin (BTC) has seen a rash of bearish signs this week, with analysts pointing to record ETF outflows, a weakening Elliott Wave count, a large drop in capital efficiency, and a chart comparison to the 2018 cycle bottom, even as one of the same voices argued the cryptocurrency’s longer-term bull case was still intact.

Bitcoin’s capital efficiency declined sharply through market cycles, said CryptoQuant CEO Ki Young Ju in a series of posts on X. The current cycle, 2022 to 2026, required $697.378 billion in realized-cap growth to produce a 689% price return, compared with just $2.7986 billion for a 55,436% return in the 2011-2013 cycle, he said.
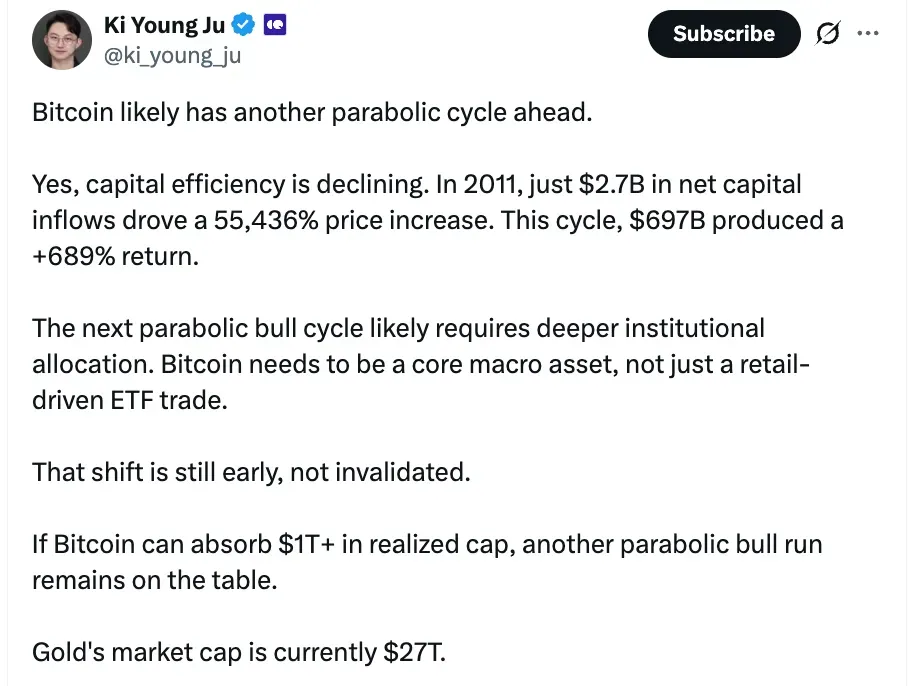
Separately, he said it now requires about $101.1 billion in net inflows of capital to double the price of Bitcoin, up from $5 million in 2011. A future parabolic cycle "remains on the table” but would probably require trillions of dollars of institutional inflows, Ki Young Ju said.
Signs The Bear Market Isn't Done
In a note, 10x Research Elliott Wave analysis was “playing out” as expected, with Bitcoin moving from a Wave (A) low near $63,000 to a Wave (B) high near $82,000, then a Wave (C) decline that the firm said would extend towards $50,000. At the time of the report, the firm said Bitcoin was approaching the $55,000 level.
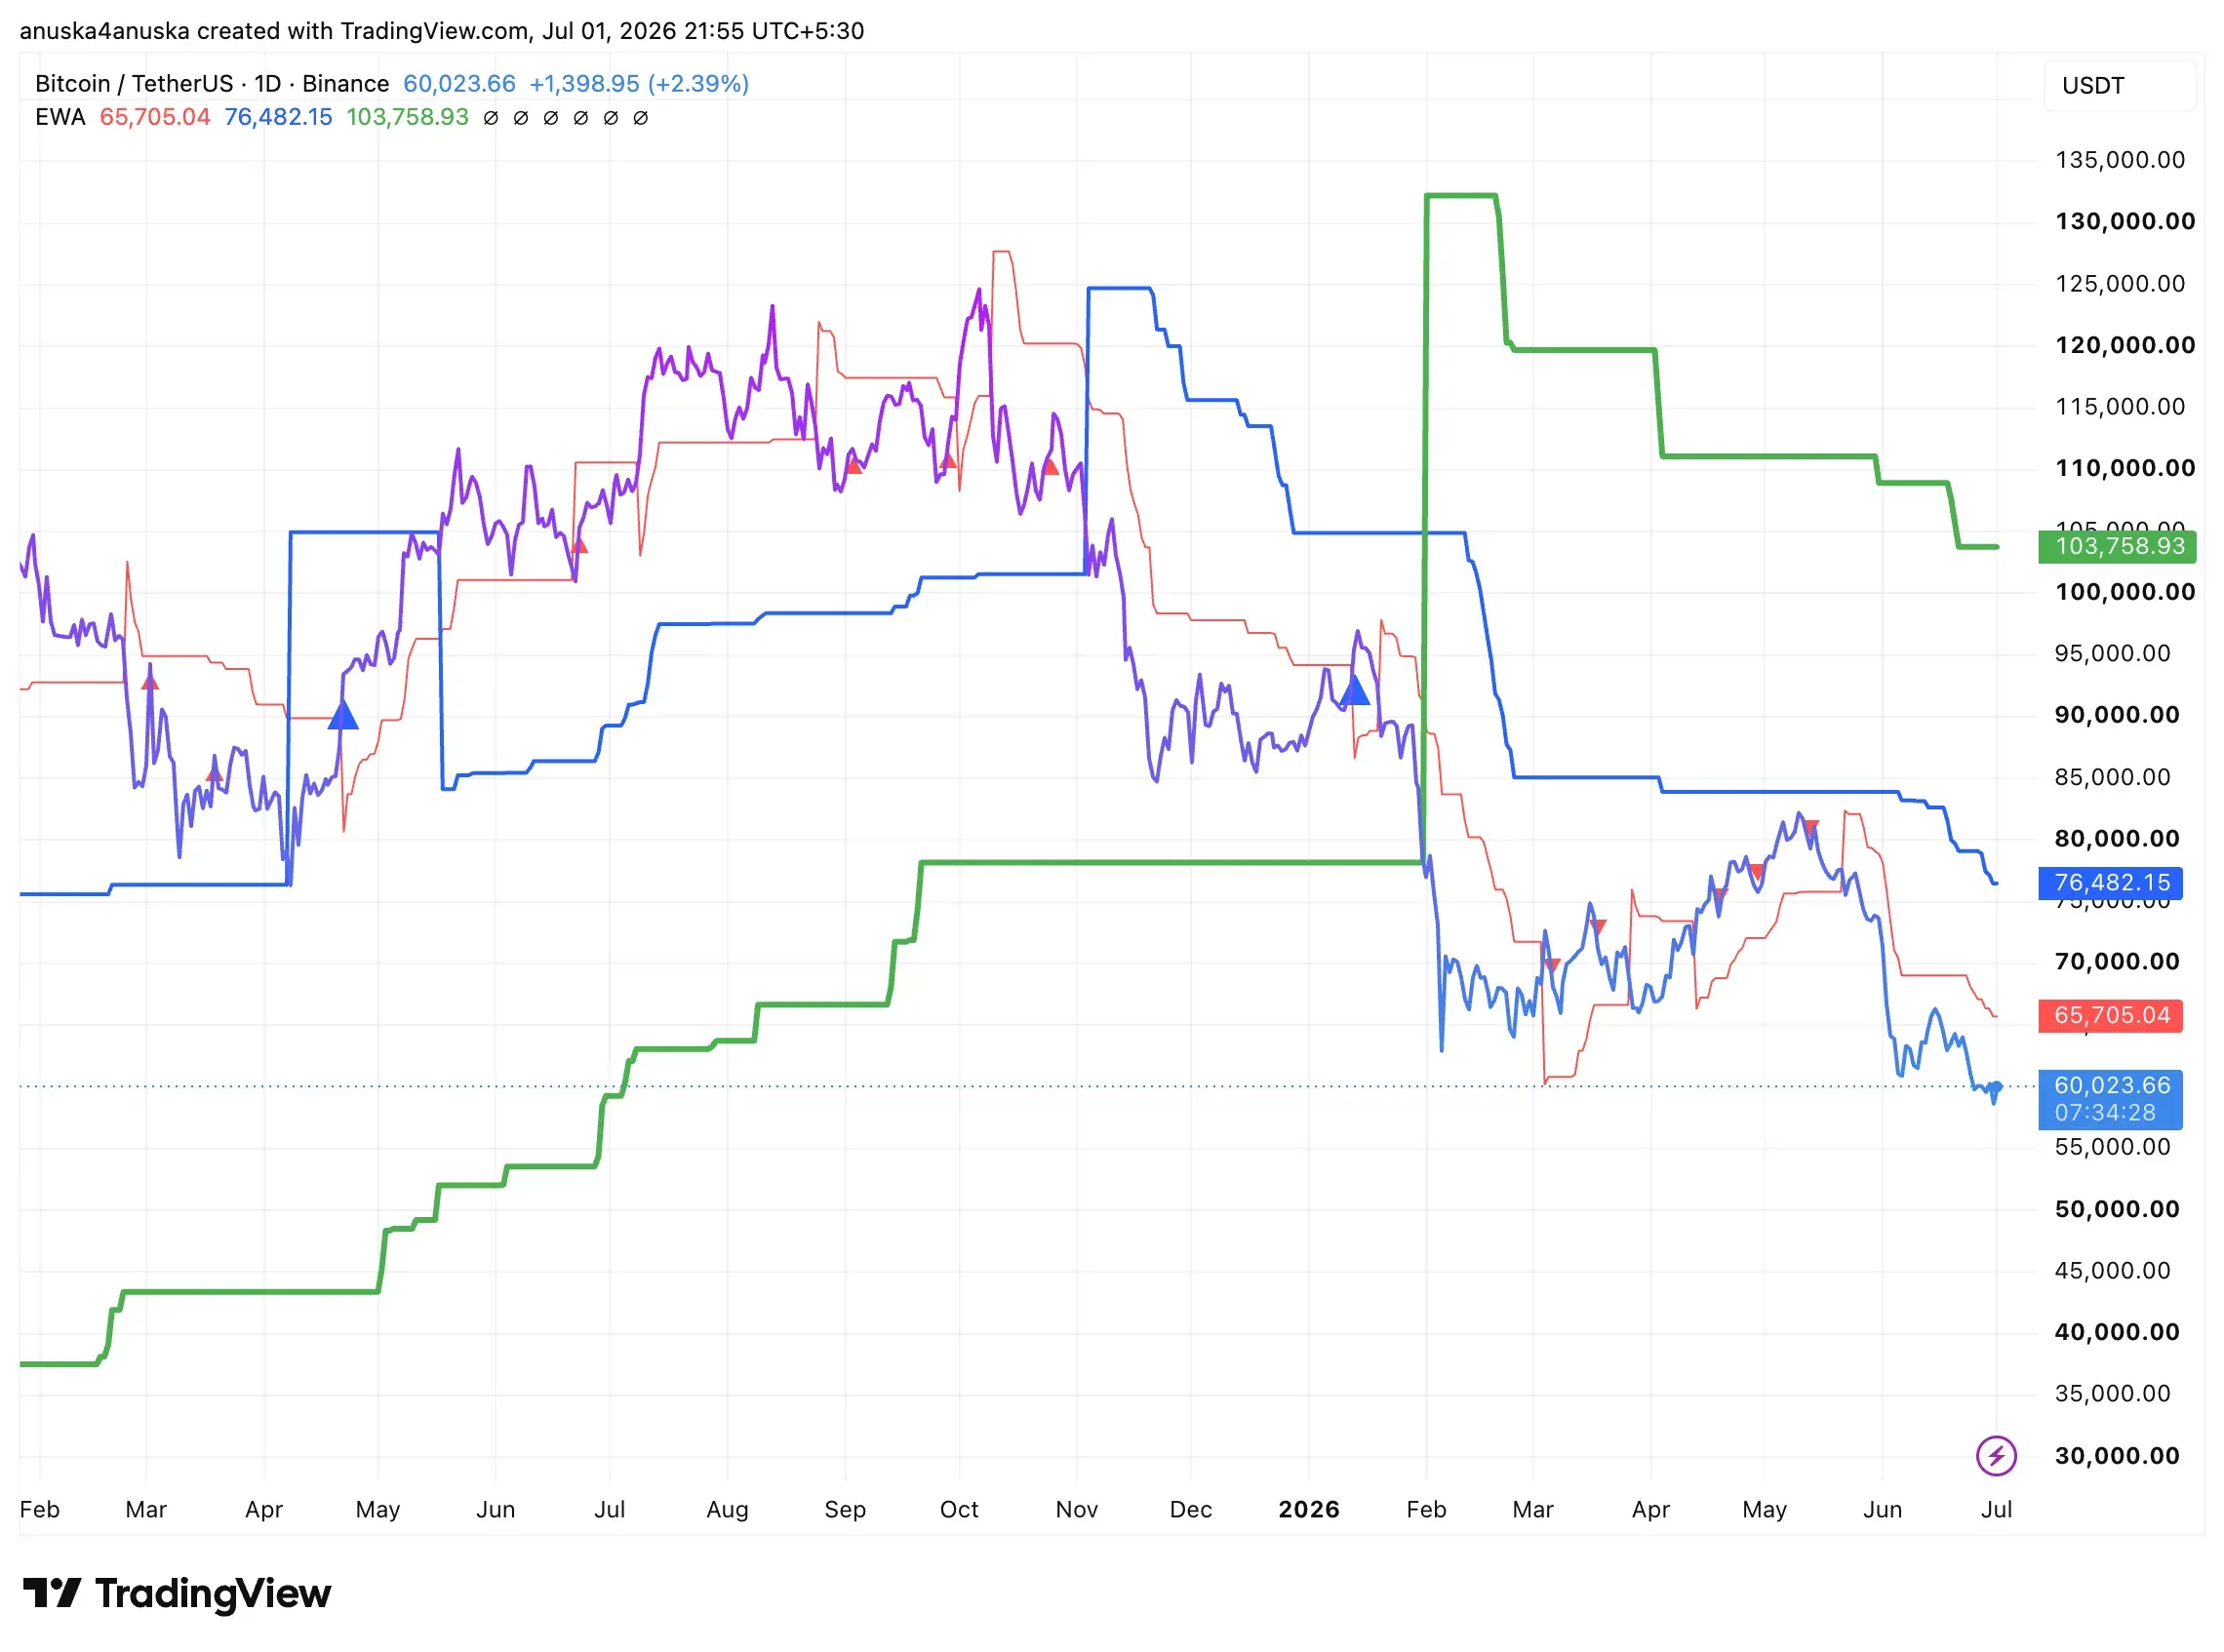
An Elliott Wave chart pointed to a bearish trend as Bitcoin traded at $60,024 on July 1, well below the $65,705, $76,482, and $103,759 levels seen on the chart, and at the bottom end of its range over the last year.
Separately, Ecoinometrics said Bitcoin ETFs saw their largest monthly outflows since the funds launched in June, when Bitcoin dropped 17%. Under the firm’s flow model, which simulates rolling 30-day demand for ETFs, outflows continued under all scenarios the firm tested. Even under its most optimistic case, net outflows continued at about 43,000 BTC, the firm said.
Ecoinometrics maintained a protective posture on Bitcoin until ETF flows rebounded and the macroeconomic environment improved.
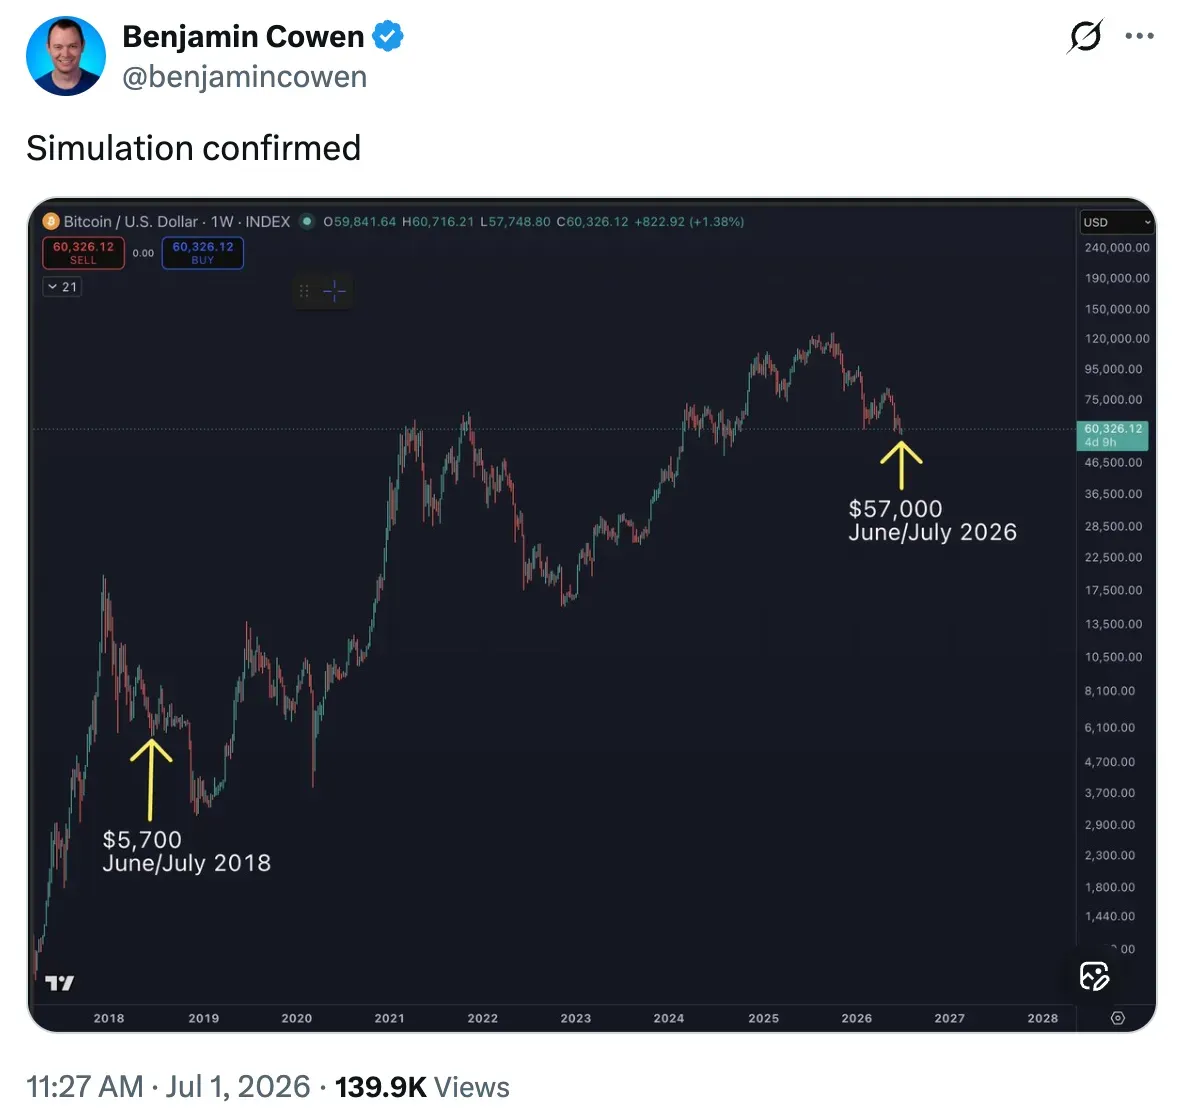
Bitcoin’s current level is reminiscent of its $5,700 price in June/July 2018, said analyst Benjamin Cowen, who captioned a weekly chart “simulation confirmed” as Bitcoin’s price traded around $60,326. On Stocktwits, retail sentiment around BTC remained in the ‘neutral’ zone, while chatter stayed at ‘normal’ levels over the past day.
Read also: Hut 8-Backed American Bitcoin To Slash Share Count By More Than 90% In Reverse Split
For updates and corrections, email newsroom[at]stocktwits[dot]com.<
