
The Nifty is back near the price-to-earnings (P/E) multiple it reached at the COVID low. But valuation is only half the story. US bond yields are above 5%, the rupee is near 96 to the dollar, and corporate profits are growing faster in parts of Asia. Together, these forces have changed how global investors compare India with other markets.
Over the past few weeks, one question has come up in almost every conversation I have had with investors, colleagues and friends: Is the Indian market finally cheap? It is a fair question. It is also, I think, the wrong one to ask on its own. A stock market can look inexpensive compared with its own past and still look costly next to other places where an investor could put money.
Consider what happened on September 29. The rupee slipped past 96 to the dollar for the first time, touching 96.15 before the RBI stepped in. Brent crude was above $105 a barrel. India’s 10-year government bond yield—the annual return investors demand for lending to the government for ten years—touched 7.18%, a two-year high. The Nifty closed at 22,716, ending the September derivatives series 5.7% lower. There were no circuit breakers and no panic. India’s market has been sliding for two years, and it has done so quietly.
To understand why, you have to follow the money. It does not start in Mumbai. It starts in Washington, DC, where the return available on US government bonds helps shape how investors value opportunities around the world.
Related Articles

THE VALUATION
In early 2020, the Nifty crashed 38% in two months and recovered within the year. This time, there has been no single crash. From its record close of 26,216 in September 2024, the index has slid about 13% over twenty-four months.
On trailing earnings—that is, profits companies have already reported over the past year—the Nifty now trades at nearly 19 times earnings. That is close to the 18.5 times it touched at the COVID-19 market bottom and well below the 23–24 times seen in 2024.
That comparison is accurate, and it is being widely shared. But a price-to-earnings ratio means little in isolation. It compares a company's or market's price with the profits it generates; in simple terms, it tells you how much investors are paying for each rupee of earnings.
The ratio has to be measured against what else your money could earn. In March 2020, the answer was almost nothing. Today, it is a great deal.
THE BOND MARKET
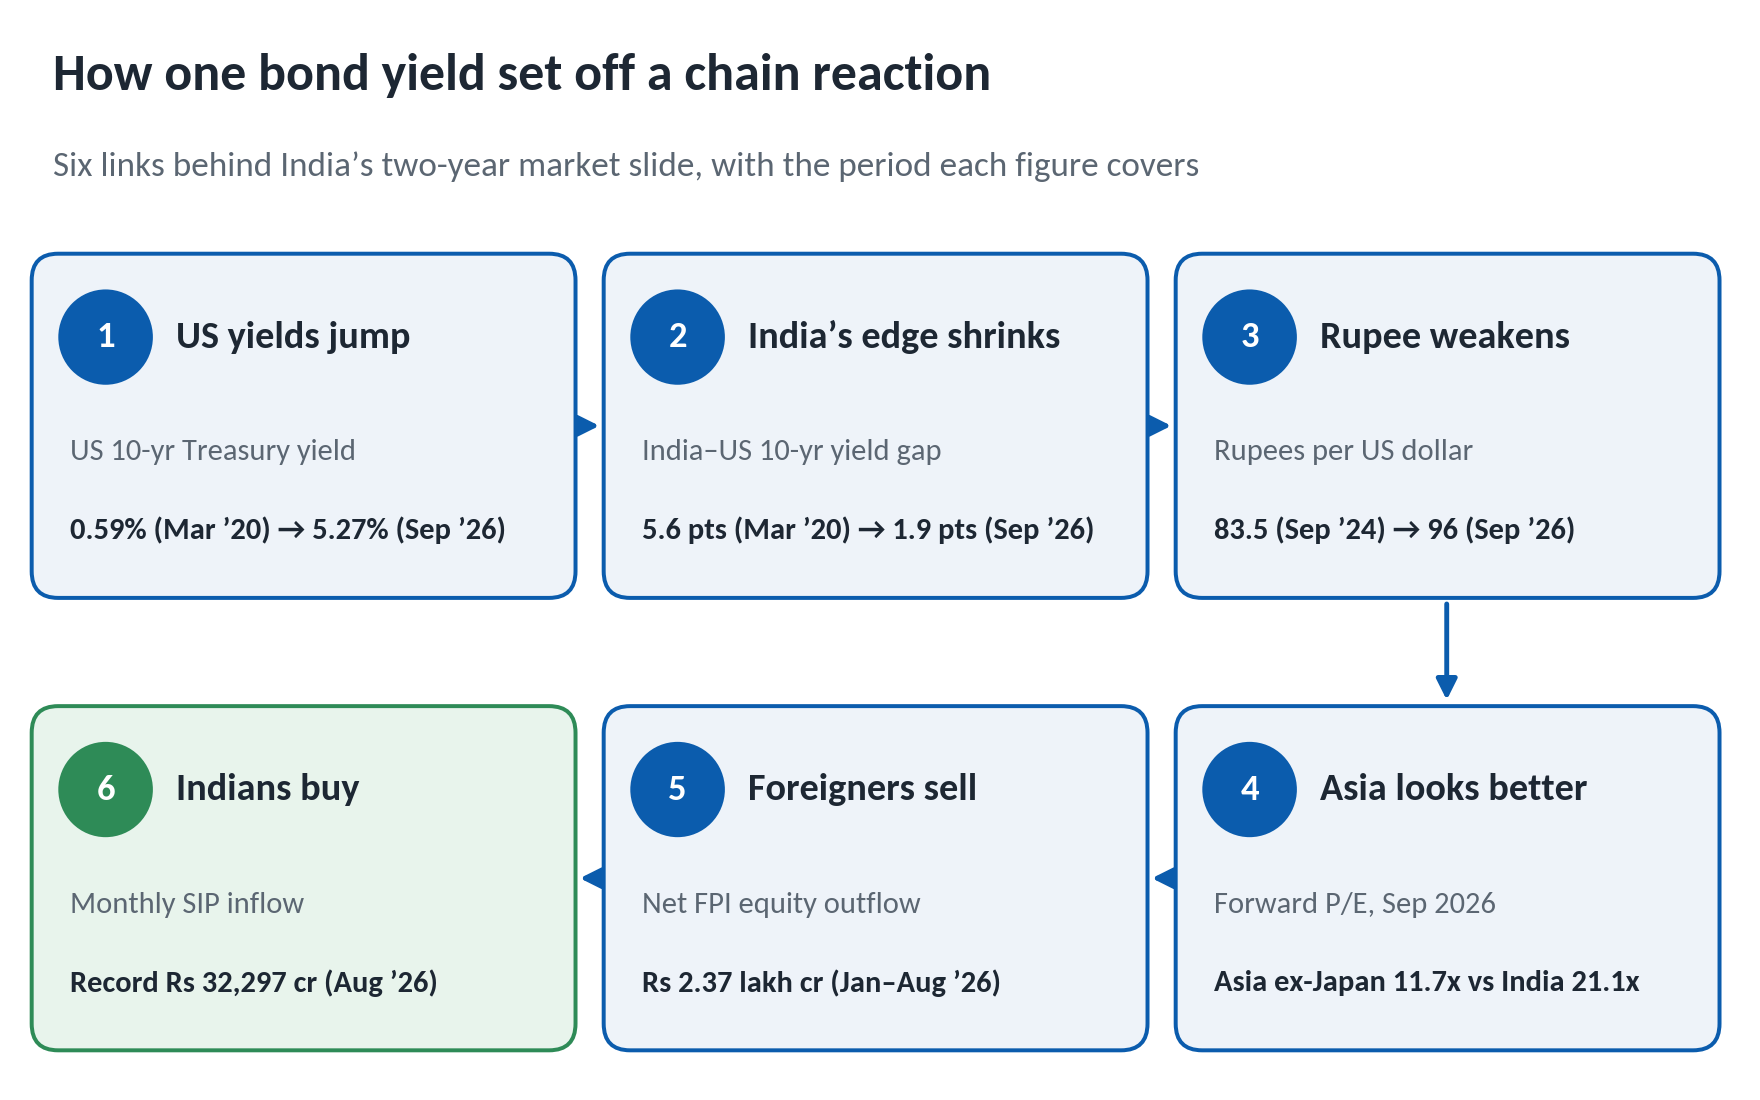
At the COVID-19 low, the US 10-year Treasury yield was 0.59%. Cash and safe bonds offered very little, so markets that had fallen sharply became magnets for global capital—and India received its share.
Today, the same US bond yields about 5.27%, close to a two-decade high. A global pension fund can earn more than 5% a year in US dollars by lending to the US government, with very low credit risk. Indian equities now have to offer enough potential additional return to compensate for currency movements, taxes and the risk of prices falling.
India's own 10-year government bond yield has risen to 7.18%, but the gap between Indian and US 10-year yields has narrowed from about 5.6 percentage points in March 2020 to under 2 points today. That gap matters because it helps investors compare the additional return offered by Indian bonds with US bonds.
The currency adds another hurdle. The rupee has moved from 83.5 per dollar at the Nifty's September 2024 peak to 96 today. In rupee terms, the Nifty is down about 13% from its peak. For a dollar-based investor, the loss is closer to 25%, because converting the investment back into dollars buys fewer dollars than before. Roughly half of the loss has come from the currency alone.
INDIA IS GROWING FAST. SO WHY IS THE MARKET LAGGING?
This is the part of the story that surprises most people.
India remains the fastest-growing major economy in the world. GDP—the value of goods and services produced across the economy—grew 7.8% in April–June, and the IMF projects 7.0% growth for 2026, more than twice the global rate.
But stock markets do not directly price GDP growth. They price the profits investors expect companies to make.
And at the moment, the two are moving apart.
DBS Bank expects Indian corporate earnings to grow 7.4% in 2026, compared with 76% for Asia ex-Japan—the group of Asian markets excluding Japan—where the AI hardware cycle is boosting profits at companies in South Korea and Taiwan.
Since December, Jefferies notes, FY27 earnings estimates—forecasts for the financial year ending in 2027—have risen 19% for Japan and 18% for South Korea, but only 1% for India, even though both economies are growing at a fraction of India's pace.
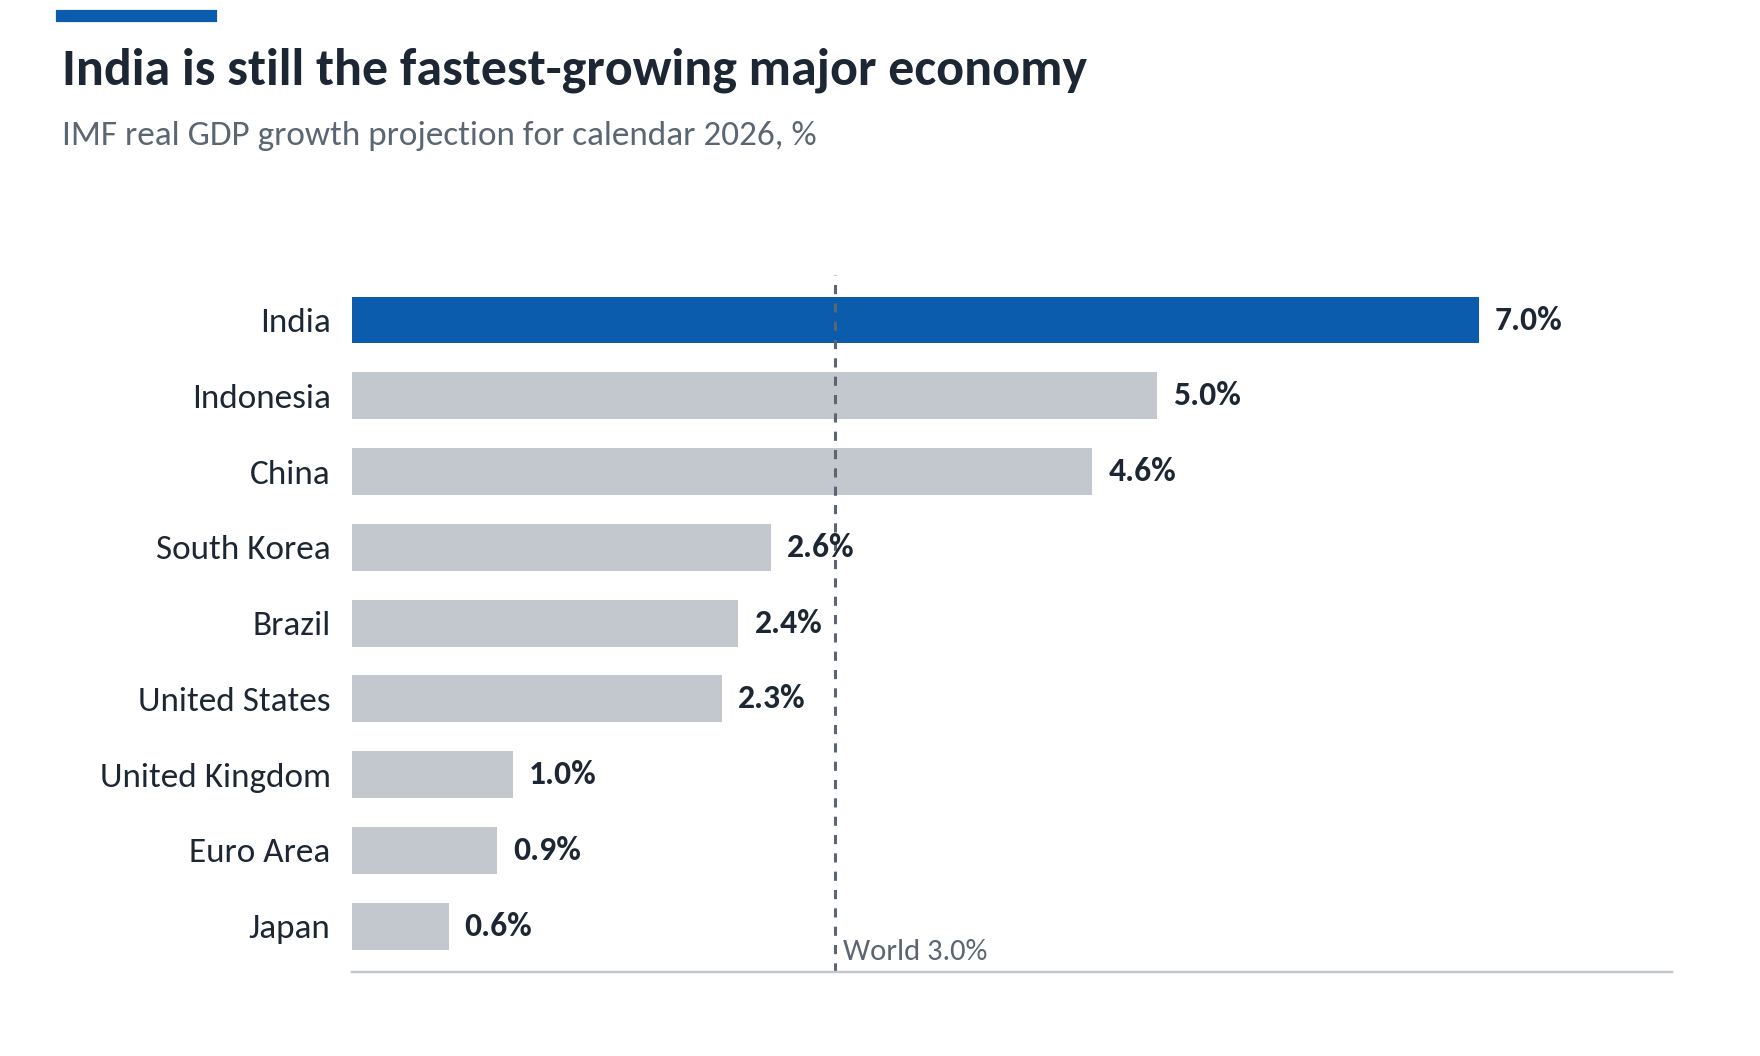
Source: IMF World Economic Outlook Update, July 2026
WHERE THE MONEY IS GOING
India trades at about 21 times forward earnings, meaning the market price is compared with analysts’ estimates of the next year’s profits rather than profits already reported. Asia ex-Japan trades at 11.7 times, with much stronger expected profit growth.
In other words, investors are being asked to pay almost twice as much for each rupee of forecast earnings in India. Global investors have historically paid a premium for India because they expected faster earnings growth. For now, that growth is showing up elsewhere.
Stock markets do not price GDP. They price profits, and in 2026 the two have come apart.
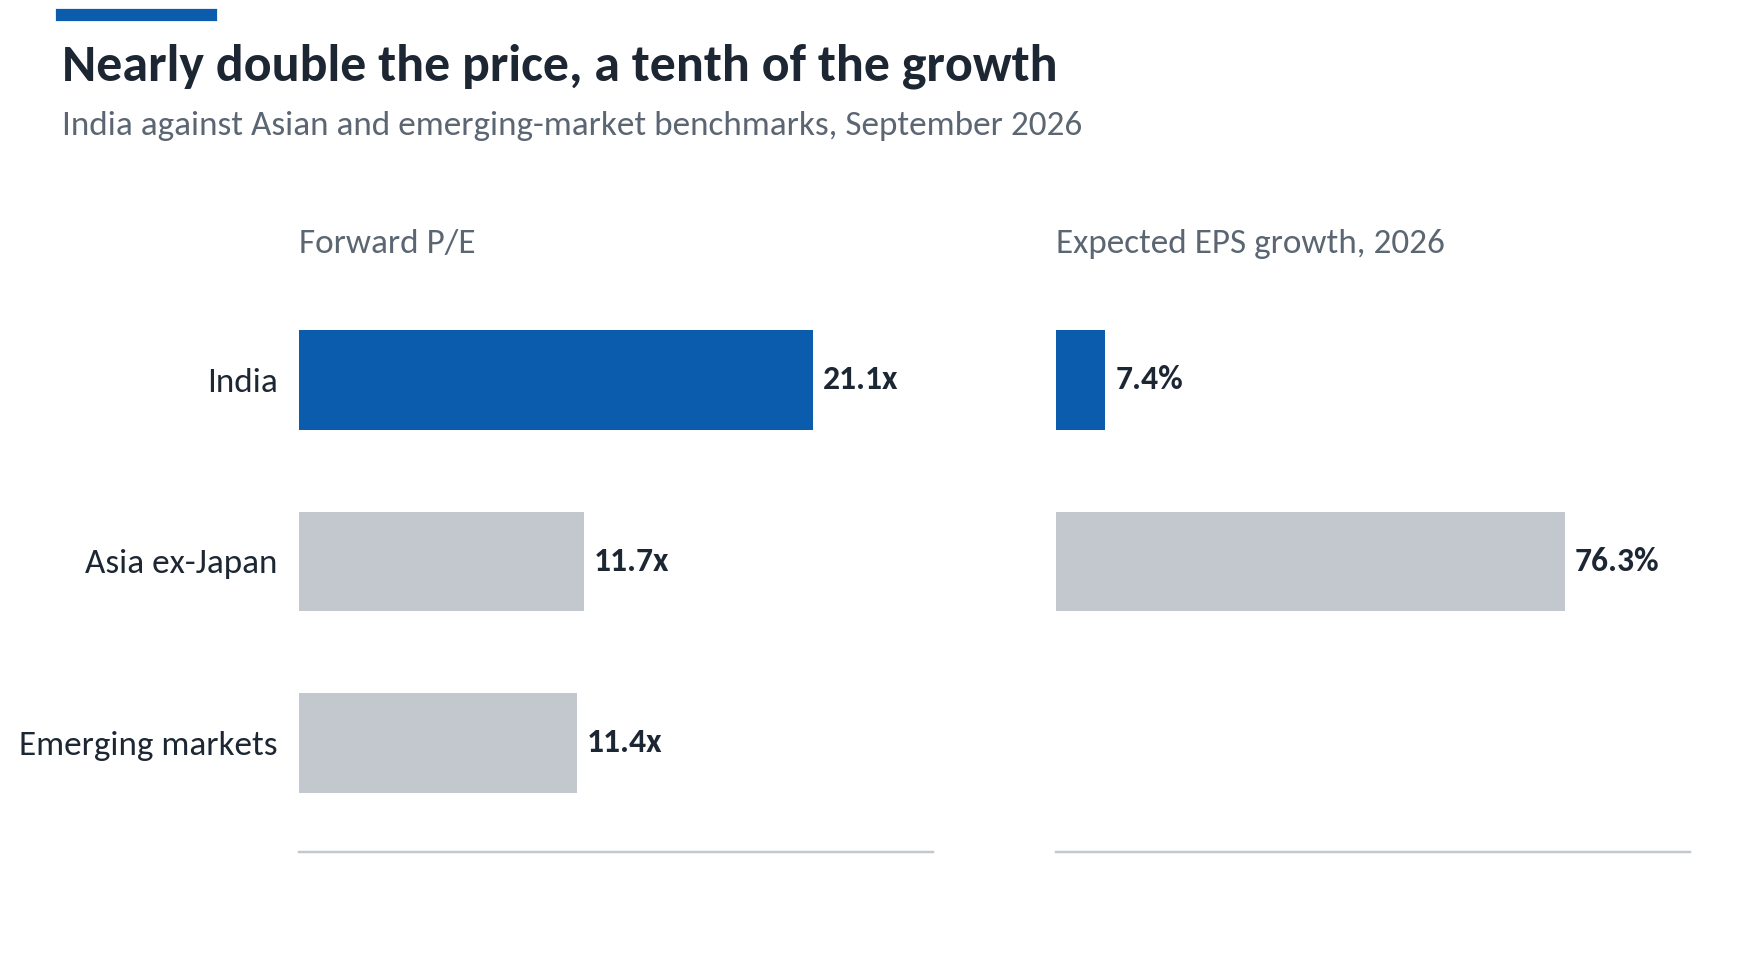
Source: DBS Bank, via Business Today, 29 Sep 2026.
WHO IS BUYING INDIAN STOCKS WHEN FPIs SELL?
The result has been sustained foreign selling. Foreign portfolio investors (FPIs)—overseas funds that invest in listed shares and bonds—sold a record Rs 1.76 lakh crore in FY26 and more than Rs 2.37 lakh crore in calendar 2026 by mid-August, followed by another Rs 21,000 crore in September.
Selling on that scale would once have put severe pressure on the market. It has not, and that is perhaps the most important change of all.
Domestic institutions, including mutual funds and insurers, bought Rs 8.31 lakh crore of equities in FY26. Monthly systematic investment plan (SIP) contributions—regular, scheduled investments often made by households into mutual funds—also reached a record Rs 32,297 crore in August, according to AMFI.
Millions of Indian households now play a role that foreign capital once played. Their steady buying has helped absorb a significant portion of the shares sold by foreign investors, allowing the market to decline gradually rather than collapse.
In 2020, foreign investors who sold during the March sell-off returned within months because there were few places offering meaningful returns at comparable levels of safety. In 2026, they have more alternatives—and are choosing among them.
WHY ARE STT COLLECTIONS RISING IN A FALLING MARKET?
One participant has benefited from the increased trading activity: the exchequer, or government treasury.
Securities Transaction Tax (STT), a tax charged on certain securities-market transactions, reached Rs 40,214 crore by mid-September, up 53% from the previous year.
Capital-gains tax rates changed in July 2024, while STT on futures and options (F&O)—contracts whose value depends on an underlying asset such as a share or index—was raised in October 2024 and again in Budget 2026.
F&O turnover fell 5% in FY26, yet STT collections from the segment rose 25% to Rs 27,695 crore.
A SEBI study found that 88% of individual F&O traders lost money, with combined losses of Rs 91,685 crore. Curbing excessive speculation is a legitimate policy objective. But for a foreign fund comparing India with markets such as South Korea, a higher tax bill is another cost to factor into the investment decision—and potentially another reason to wait.
INDIA'S LONG-TERM CASE HAS NOT DISAPPEARED
It would be easy to read all of this as a verdict on India. It is not. Almost every pressure described above comes from outside India's borders: American interest rates, oil prices and a chip boom centred in North Asia. The factors that shape where an economy stands a decade from now are largely domestic.
India's long-term strengths remain relevant, even if they do not automatically translate into stronger share prices today.
1. A young, growing workforce
With a median age under 30, India is expected to add more people to its working-age population over the next decade than any other major economy, at a time when China, Japan, South Korea and much of Europe are ageing.
A larger workforce can support production and consumption, provided enough productive jobs are created.
2. Macro stability under stress
Even with Brent crude above $105 a barrel, India's current account deficit—the gap between money flowing out of the country for goods, services and income and money flowing in—was just 0.5% of GDP in April–June, cushioned by a $51.6 billion services surplus, according to RBI data.
Foreign-exchange reserves, the country's stock of foreign currency assets, stood near $766 billion, while retail inflation was 4.82% in August, according to MoSPI.
3. An investment and manufacturing upswing
Manufacturing output grew 9.2% in April–June, while nominal GDP—GDP measured at current prices without adjusting for inflation—is expanding at around 10%.
Public spending on roads, railways, power and digital infrastructure is laying the foundation for private investment and business expansion. The key question for investors is how much of that activity ultimately translates into higher corporate profits.
4. A domestic capital base that did not exist a decade ago
Monthly SIP contributions above Rs 32,000 crore and more than 21 crore demat accounts—electronic accounts used to hold shares and other securities—mean Indian households and institutions now provide a substantial source of capital for the equity market.
That domestic demand has helped absorb some of the shares sold by foreign investors. It has contributed to an orderly correction, although it cannot guarantee that markets will remain orderly indefinitely.
5. A reset in valuation and positioning
The Nifty's price-to-earnings multiple has fallen from 23–24 times to about 19 times, while foreign ownership has declined sharply after two years of selling.
A lower valuation can make a market more attractive to investors who were previously unwilling to pay higher prices. But valuation alone does not guarantee a recovery. Earnings ultimately have to justify the price.
| COVID, March 2020 | Today, September 2026 | |
| Shape of the fall | 38% crash in two months | 13% decline over two years |
| Nifty trailing P/E | About 18.5x | About 19x |
| US 10-year yield | 0.59% | 5.27% |
| India 10-yr yield premium over US 10-yr Treasury | About 5.6 points | About 1.9 points |
| Brent crude | Below $30 | Above $105 |
| Rupees per US dollar | About 76 | About 96 (83.5 at the Sep 2024 Nifty peak) |
| What rescued the market | Foreign money, returning fast | Domestic SIPs, holding the floor |
WHAT WILL IT TAKE FOR MARKET TO RECOVER?
Until then, Indian savers may continue buying market dips while foreign funds wait. Lower valuations may create opportunities for long-term investors, but they do not eliminate the risk of further declines. The case for investing will ultimately depend on an individual's time horizon, risk tolerance and the earnings companies deliver.
A sustained recovery could depend on several key signals:
- Crude settling between $85-90
- The rupee holding steady for two consecutive quarters
- Earnings upgrades that convert India's GDP lead into profit growth
- Tax policy that stops adding to the cost of investing
In 2020, India rebounded because money was cheap and the world was hungry for growth. This time, a recovery will have to be earned rather than handed over. India still has strong growth prospects, favourable demographics and a significantly larger domestic capital base.
A cheaper Nifty opens the door. Earnings will determine whether global capital walks back through it.
Sources: NSE | RBI MoSPI/NSO | US Treasury | IMF WEO July 2026 | NSDL | AMFI | SEBI | CBDT / Income Tax Department | Union Budget | DBS Bank and Jefferies research notes, September 2026.
Disclaimer: Views expressed are personal. This article is for information only and is not investment advice. Readers should consult a SEBI-registered adviser before investing.