
Analysts remain bullish on long-term fundamentals but flag near-term caution due to margin compression and chart resistance.
HDFC Bank shares rose 2% on Monday after the bank posted a stable June quarter earnings performance. The bank reported a strong 12% year-on-year growth in net profit, which came in at ₹18,155 crore, supported by healthy loan growth and operational efficiency.
Its financing profit came in at a -₹24,833 crore, widening sharply from -₹7,916 crore in Q4 FY25 and -₹12,723 crore in Q1 FY25, pulling the financing margin down to -28%, its weakest in several quarters.
Net interest income (NII) rose 5.4% to ₹31,438 crore, reflecting stable core performance. However, there was a slight dip in net interest margins (NIMs), which slipped to 3.9% from 4.1% a year ago, due to rising deposit costs and tight competition in the lending space.
Asset quality showed mild pressure, with gross NPA rising to 1.4% (vs. 1.33% in March) and net NPA at 0.47% (vs. 0.43%). Provisions for the quarter stood at ₹3,193 crore, but the bank also created ₹9,000 crore in floating provisions and ₹1,700 crore in contingency buffers, signaling a prudent risk approach, noted analyst Harika Enjamuri.
Despite the margin compression, market sentiment remained positive, especially after the bank announced a 1:1 bonus share issue and a ₹5 special interim dividend. Analyst Akhilesh Jat noted that the stock's early rally indicated that investors are betting on HDFC Bank’s long-term fundamentals and its ability to navigate margin pressures effectively.
Technical Trends
On the technical charts, HDFC Bank is showing signs of short-term exhaustion after a strong rally. On the daily chart, the stock has formed a near-term double top around the ₹2,020–2,025 zone, a level where it is now facing clear resistance. Importantly, it's hovering just above the 70-day Exponential Moving Average (EMA) at ₹1,941. A breakdown below this could invite further profit booking towards ₹1,880, which is the 100-day moving average and a crucial support level.
On the weekly chart, the broader trend remains bullish, with higher highs and higher lows since mid-2024, supported by the 9-week EMA (₹1,964) and 100-week EMA (₹1,664). However, its Relative Strength Index (RSI) at 59.68 on the weekly chart indicates the stock is no longer in overbought territory but still holds strength. Enjamuri identified immediate support at ₹1,940–1,880, while resistance is strong at ₹2,025–2,040.
She believes that a decisive breakout above this zone, with volume confirmation, could rally towards ₹2,100+, but failure to sustain may lead to a healthy pullback. For the short term, cautious consolidation is likely, and bullish momentum will resume only on a strong close above ₹2,025. Until then, she advised traders to watch for confirmation of a breakdown below ₹1,940 for downside risk and adjust position sizing accordingly.
Meanwhile, analyst Saurabh Sahu noted that while the bank’s fundamentals remain sound, the higher provisions and softer margins indicate near-term caution. Technically, the stock is facing resistance near the ₹2,020–2,050 zone, where it has recently faced rejection. Immediate support is seen at ₹1,920–1,940, and below this, ₹1,880 becomes a key level.
Sahu also highlighted that its recent upmove lacked aggressive volume and hence, near-term consolidation is likely. While the medium-term uptrend remains intact, its short-term outlook is range-bound between ₹1,900 and ₹2,050 until a breakout is achieved.
Paresh Shah identified resistance between ₹2,020 and ₹2,040, with support levels at ₹1,910, ₹1,880, ₹1,820, and ₹1,780. He sees the likelihood of a range-bound move after some corrections.
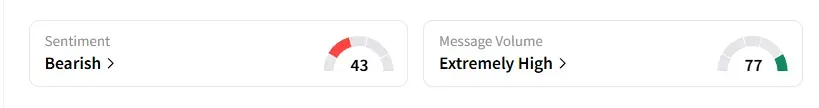
Data on Stocktwits shows that retail sentiment is ‘bearish’ amid ‘extremely high’ message volumes.
HDFC Bank shares have risen 12% year-to-date (YTD).
For updates and corrections, email newsroom[at]stocktwits[dot]com.<
