
A new study conducted by scientists at the University of Leeds has revealed a staggering global plastic pollution crisis, highlighting the deadly consequences of insufficient waste collection.
A new study conducted by scientists at the University of Leeds has revealed a staggering global plastic pollution crisis, highlighting the deadly consequences of insufficient waste collection. The research, which utilized artificial intelligence (AI) modelling, identified the 10 countries responsible for the highest levels of plastic pollution and warned that millions of lives are at risk due to the improper disposal of waste.
52 million tonnes of plastic uncollected in 2020
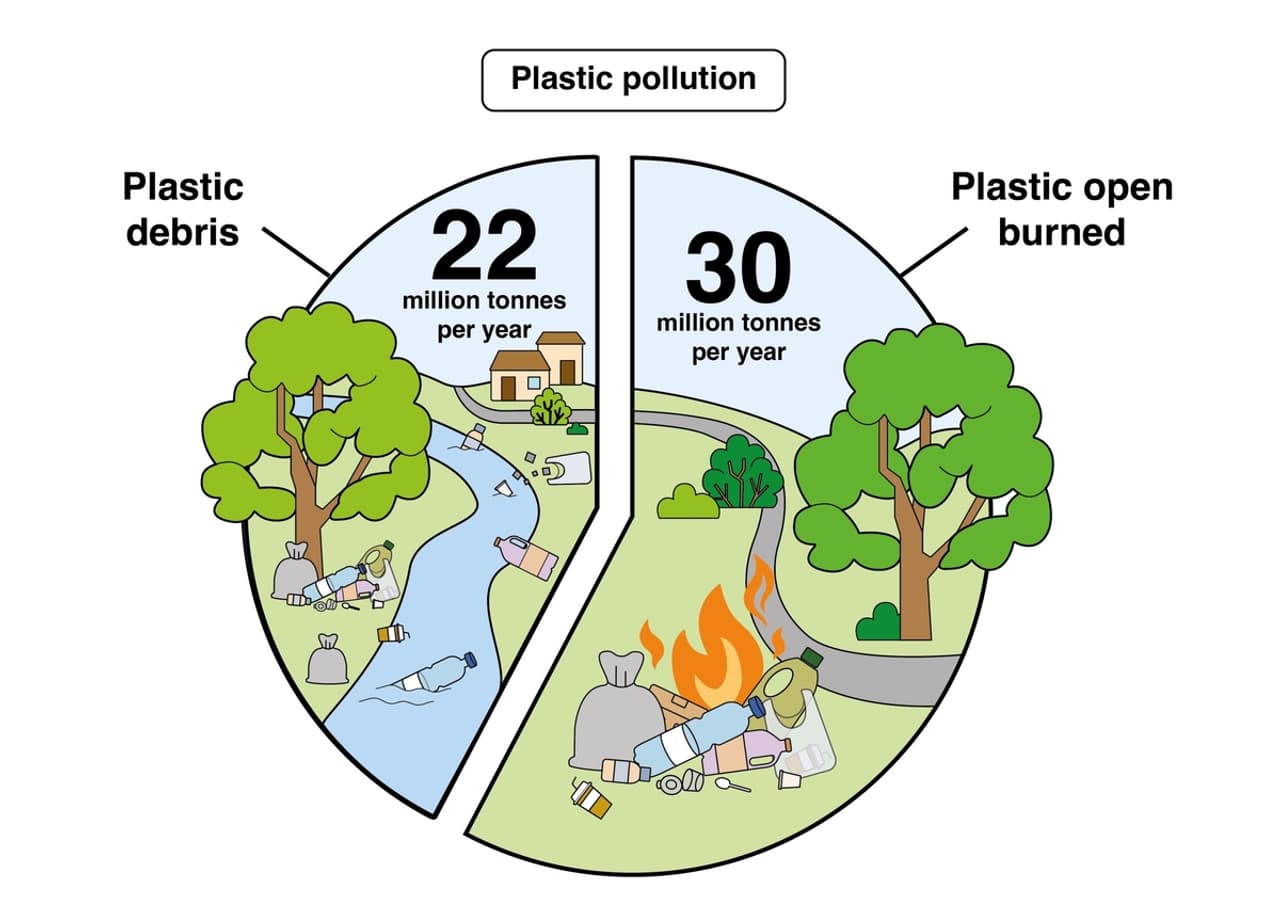
According to the study, 52 million tonnes of uncollected plastic waste were released into the environment in 2020, significantly raising health concerns for the affected populations. Dr. Costas Velis, the lead author of the study, emphasized the severity of the issue: “This is an urgent global human health issue—an ongoing crisis: people whose waste is not collected have no option but to dump or burn it.”
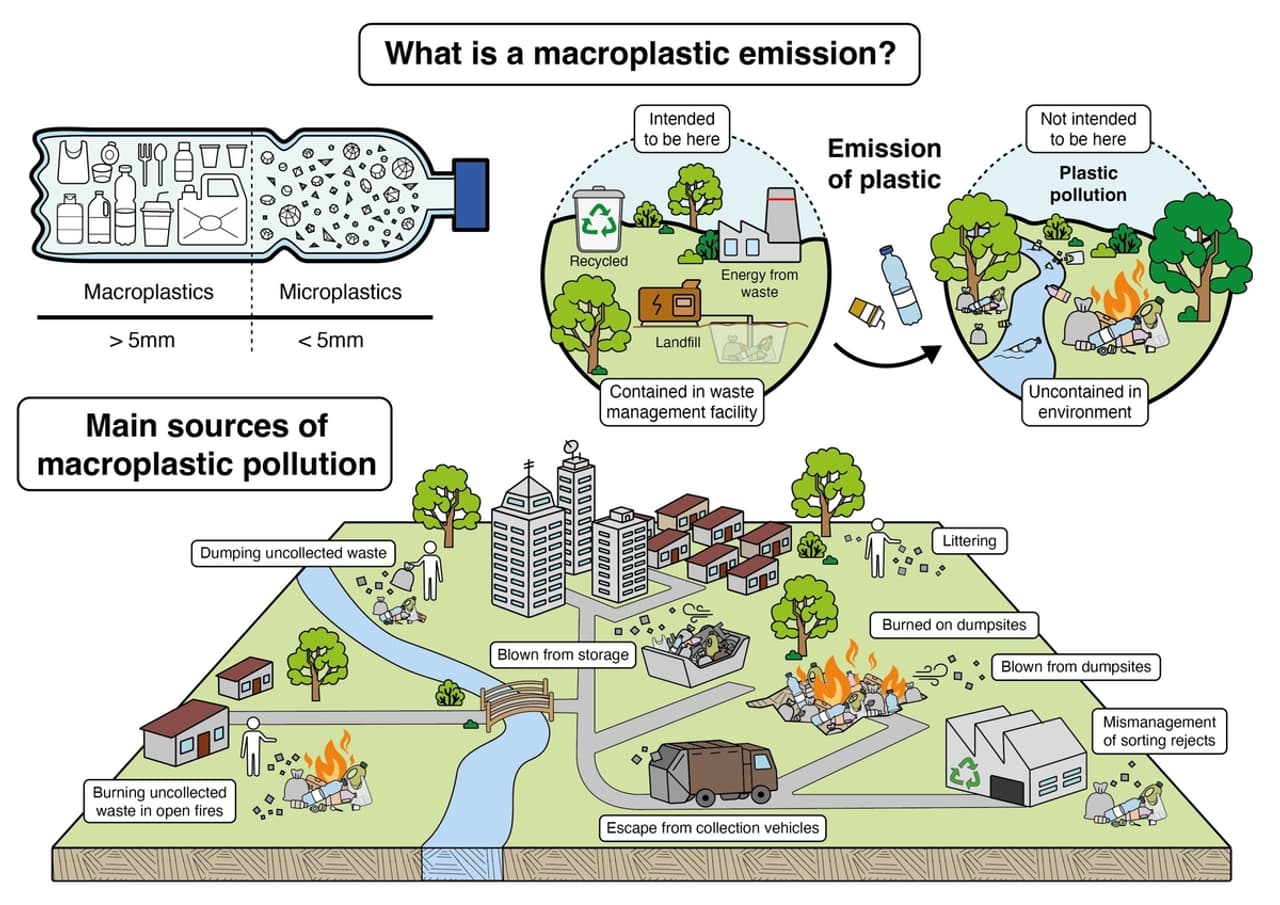
AI-powered modelling, based on data from 500 cities across 127 countries, allowed researchers to predict annual waste production and track the fate of plastic. Globally, more than 400 million tonnes of plastic are produced every year, and approximately 52 million tonnes of it are either burned or dumped openly, contributing to environmental degradation and severe health risks.
(Infographic Credit: Dr. Angeliki Savvantoglou of Bear Bones)
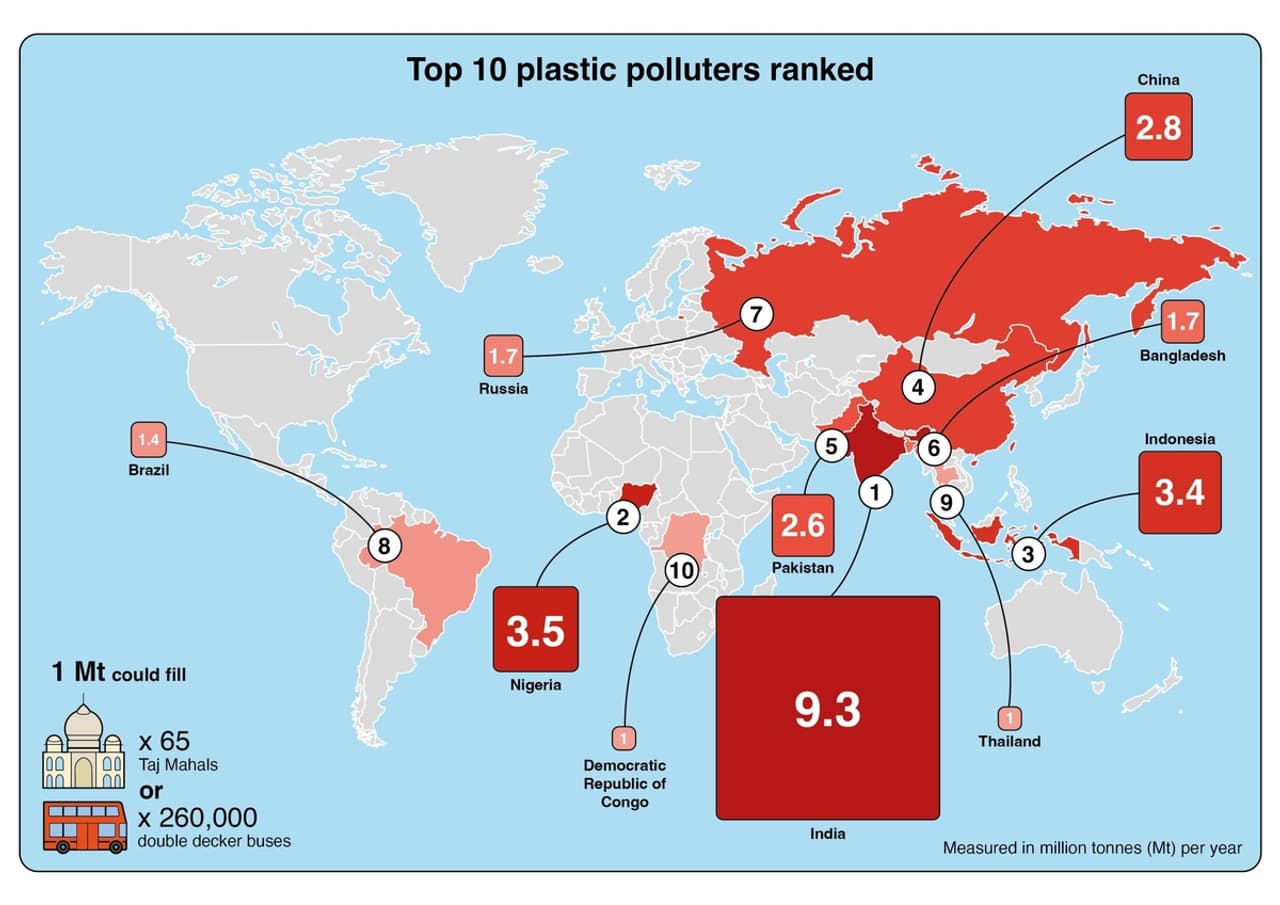
India: The world's biggest plastic polluter
Contrary to earlier studies that identified China as the leading contributor to global plastic pollution, the latest findings revealed that India is now the top polluter. In 2020, India generated 9.3 million tonnes of plastic waste, accounting for nearly a fifth of the world’s uncollected plastic. This situation is exacerbated by the country's massive population of 1.4 billion and poor waste collection infrastructure.
India’s plastic waste output exceeds that of Nigeria and Indonesia, the second and third largest polluters, respectively. Nigeria produced 3.5 million tonnes of plastic waste, closely followed by Indonesia with 3.4 million tonnes. China, once the world’s largest polluter, has improved its waste collection and processing systems, dropping to fourth place with 2.8 million tonnes.
High plastic production in Sub-Saharan Africa
The report also highlights significant concerns in sub-Saharan Africa. Despite producing less plastic overall compared to larger nations, countries in this region generate a disproportionately high amount of plastic waste per capita. For example, the Democratic Republic of the Congo was ranked as the tenth biggest producer of plastic waste in 2020, contributing one million tonnes. Sub-Saharan Africa averaged 12 kilograms of plastic pollution per person in 2020, the equivalent of 400 plastic bottles per person annually.
In comparison, the UK, which ranked 135th in the study, produces just three plastic bottles worth of pollution per person each year, generating only 4,000 tonnes of plastic waste annually. The US, though more significant in plastic production, ranked 90th, with 47,649 tonnes of waste per year—over 10 times more than the UK.
(Infographic Credit: Dr. Angeliki Savvantoglou of Bear Bones)
Burning of plastic waste: A serial killer
One of the most alarming findings from the study is the prevalence of open burning of plastic waste in countries lacking proper waste collection. In 2020, over half of the world’s uncollected waste—30 million tonnes—was burned without environmental controls, releasing harmful toxins into the air.
Dr. Velis noted the devastating effects of this practice, “Setting the plastics on fire may seem to make them ‘disappear,’ but the open burning of plastic waste leads to substantial human health damage, including neurodevelopmental, reproductive, and birth defects, as well as widespread environmental pollution.”
Communities in poorer countries, which lack access to safe disposal methods, are the most affected by these toxic emissions. The study estimates that 15% of the world’s population—roughly one billion people—live without waste collection services, leaving them vulnerable to the health risks posed by plastic pollution.
Waste exports and global inequities
The researchers also highlighted the ethical concerns surrounding the export of waste from richer countries to poorer nations. Although it is illegal in the UK to export waste for anything other than recycling, investigations have shown British waste being dumped illegally on roadsides in Turkey and in landfills in Indonesia. This global inequality worsens the pollution crisis, as poorer nations are left to manage waste from wealthier countries without adequate facilities.
Dr. Josh Cottom, a co-author of the study, stressed the importance of addressing this crisis, "The health risks resulting from plastic pollution affect some of the world’s poorest communities, who are powerless to do anything about it. By improving basic solid waste management, we can both massively reduce plastic pollution and improve the lives of billions.”
(Infographic Credit: Dr. Angeliki Savvantoglou of Bear Bones)
The study underscores the urgent need for global cooperation to address the plastic waste crisis. While developed nations, such as those in Europe and the US, produce significant amounts of plastic, they tend to manage it more effectively through better collection and processing systems. However, the research emphasizes that wealthier countries must take responsibility for the waste they generate and ensure that it is not offloaded onto poorer nations without the capacity to handle it.
Improving solid waste management in developing countries, increasing investment in recycling infrastructure, and enforcing stricter regulations on waste exports are critical steps needed to combat the growing plastic pollution problem. Without such measures, millions of lives remain at risk, and the environmental impact of plastic waste will continue to worsen.
Which countries produce the most plastic waste?
- India: 9,275,777
- Nigeria: 3,532,479
- Indonesia: 3,352,229
- China: 2,808,179
- Pakistan: 2,567,461
- Bangladesh: 1,748,215
- Russia: 1,702,453
- Brazil: 1,444,824
- Thailand: 995,718
- Democratic Republic of the Congo: 963,328
- Philippines: 819,843
- Egypt: 807,596
- Iraq: 799,891
- Tanzania: 778,932
- Mexico: 767,447
- Vietnam: 754,959
- Myanmar: 725,433
- Ethiopia: 651,876
- Uganda: 617,565
- South Africa: 609,757
- Kenya: 602,475
- Iran: 560,725
- Angola: 550,441
- Sudan: 529,961
- Turkey: 486,398
- Afghanistan: 457,234
- Cameroon: 432,957
- Ukraine: 417,655
- Cambodia: 413,564
- Uzbekistan: 395,211
- Côte d'Ivoire: 394,834
- Ghana: 385,727
- Morocco: 385,558
- Algeria: 379,622
- Argentina: 350,880
- North Korea: 344,633
- Syria: 328,329
- Yemen: 327,239
- Mozambique: 323,380
- Sri Lanka: 273,779
- Peru: 270,769
- Guatemala: 263,614
- Venezuela: 249,864
- Nepal: 238,989
- Kazakhstan: 238,988
- Haiti: 229,493
- Somalia: 225,305
- South Sudan: 215,243
- Zambia: 215,139
- Senegal: 214,610
- Chad: 211,833
- Mali: 205,639
- Rwanda: 201,068
- Malaysia: 197,552
- Madagascar: 190,784
- Burkina Faso: 185,331
- Malawi: 171,474
- Benin: 168,522
- Zimbabwe: 162,871
- Tajikistan: 156,028
- Paraguay: 154,547
- Colombia: 153,451
- Burundi: 145,231
- Romania: 141,944
- Tunisia: 129,723
- Papua New Guinea: 129,684
- Laos: 127,090
- Honduras: 126,403
- Serbia: 126,143
- Jordan: 124,391
- Niger: 122,201
- Kyrgyzstan: 118,570
- Togo: 99,108
- Nicaragua: 99,108
- Azerbaijan: 90,491
- El Salvador: 89,809
- Ecuador: 88,460
- Guinea: 85,918
- Mauritania: 83,749
- Republic of Congo: 79,951
- Bolivia: 79,523
- Dominican Republic: 79,382
- Turkmenistan: 70,966
- Liberia: 60,755
- Sierra Leone: 59,936
- Belarus: 55,703
- Central African Republic: 50,706
- Bulgaria: 50,612
- Cuba: 48,447
- United States: 47,649
- Lesotho: 44,823
- Eritrea: 43,719
- Lebanon: 43,520
- Panama: 41,213
- Libya: 40,313
- Namibia: 36,896
- Bosnia and Herzegovina: 33,423
- Equatorial Guinea: 33,101
- Mongolia: 32,469
- Botswana: 32,272
- Gambia: 29,142
- Palestina: 28,427
- Georgia: 27,950
- Costa Rica: 24,190
- Jamaica: 23,653
- Albania: 22,259
- Guinea-Bissau: 22,175
- Kosovo: 20,974
- Swaziland: 20,084
- Djibouti: 19,978
- Timor-Leste: 18,139
- Moldova: 17,712
- Macedonia: 16,312
- Armenia: 15,872
- Comoros: 11,306
- Chile: 11,283
- Solomon Islands: 8,956
- France: 8,832
- Gabon: 7,838
- Germany: 7,725
- Italy: 7,684
- Poland: 7,079
- Maldives: 7,015
- Belize: 6,972
- Trinidad and Tobago: 6,962
- Guyana: 6,907
- Spain: 6,241
- Vanuatu: 6,209
- Japan: 6,185
- Fij:i 6,182
- Montenegro: 5,762
- Bhutan: 5,694
- Cape Verde: 5,693
- Western Sahara: 4,736
- United Kingdom: 4,622
- Suriname: 4,199
- São Tomé and Príncipe: 3,681
- Saudi Arabia: 3,444
- Mayotte: 3,079
- Canada: 3,024
- Oman: 3,019
- South Korea: 2,857
- Hungary: 2,707
- Samoa: 2,613
- Mauritius: 2,544
- Australia: 2,198
- Greece: 1,909
- Puerto Rico: 1,909
- Czech Republic: 1,549
- Taiwan: 1,398
- Lithuania: 1,393
- Micronesia: 1,361
- Kiribati: 1,354
- Austria: 1,239
- Saint Lucia: 1,185
- Portugal: 1,181
- Belgium: 1,167
- Netherlands: 1,156
- Tonga: 1,123
- Slovakia: 1,087
- Uruguay: 961
- Latvia: 956
- Sweden: 918
- United Arab Emirates: 918
- French Guiana: 916
- Croatia: 901
- Dominica: 798
- Switzerland: 731
- Grenada: 694
- Finland: 663
- Ireland: 659
- Saint Vincent and the Grenadines: 607
- Denmar:k 606
- Israel: 605
- Norway: 527
- Slovenia: 525
- New Zealand: 518
- Marshall Islands: 465
- Reunion: 392
- Hong Kong: 341
- Kuwait: 273
- American Samoa: 238
- Bahamas: 237
- Guadeloupe: 236
- Estonia: 224
- Anguilla: 218
- Martinique: 197
- Palau: 195
- Singapore: 175
- Qatar: 171
- Greenland: 142
- Barbados: 138
- Seychelles: 121
- Wallis and Futuna: 119
- Curaçao: 112
- Tuvalu: 112
- Cyprus: 106
- New Caledonia: 99
- Saint Helena: 89
- Northern Cyprus: 89
- Virgin Islands, U.S.: 78
- Brunei: 77
- Antigua and Barbuda: 71
- Luxembourg: 69
- Aruba: 68
- Saint-Martin: 63
- French Polynesia: 55
- Bahrain: 55
- Christmas Island: 48
- Saint Kitts and Nevis: 43
- Guam: 41
- Malta: 34
- Cayman Islands: 32
- Iceland: 31
- Niue: 30
- Northern Mariana Islands: 27
- Macao: 25
- British Virgin Islands: 24
- Turks and Caicos Islands: 24
- Bonaire, Sint Eustatius and Saba: 23
- Sint Maarten: 21
- Montserrat: 20
- Tokelau: 16
- Faroe Islands: 14
- Andorra: 12
- Jersey: 10
- Isle of Man: 9
- Bermuda: 8
- Guernsey: 8
- Cocos Islands: 7
- Paracel Islands: 7
- Åland: 6
- Nauru: 6
- Cook Islands: 5
- Akrotiri and Dhekelia: 5
- Saint-Barthélemy: 5
- Liechtenstein: 5
- San Marino: 5
- Falkland Islands: 3
- Monaco: 2
- Saint Pierre and Miquelon: 1
- Gibraltar: 1
- Pitcairn Islands: 1
- Svalbard and Jan Mayen: 1
- Norfolk Island: 1
- Vatican City: 0
*All figures in tonnes per year
