This Bitcoin Signal Has Flashed Just 4 Times In History, And The Prior 3 Coincided With Bear-Market Bottoms — Here’s What To Know

Synopsis
Bitcoin’s rebound above $80,000 puts focus on whether demand and longer-term technical levels could support further gains.
- Bitcoin climbed from around $76,000 to above $80,000 on Friday.
- Glassnode said Bitcoin’s Spent Output Profit Ratio remained above 1, while analyst PlanB expects a moving average near $89,000 as the next target.
- Willy Woo said Bitcoin’s monthly Fisher Transform flashed a bullish crossover.
Bitcoin (BTC) rose back above $81,000 on Saturday, bringing focus to a rare technical indicator that has occurred only four times in its history.
The latest bullish crossover on Bitcoin’s monthly Fisher Transform was the fourth since 2011, according to analyst Willy Woo. The previous three all preceded bear-market bottoms. Woo said, “BTC bottoms: 3 for 3 without fake-out."
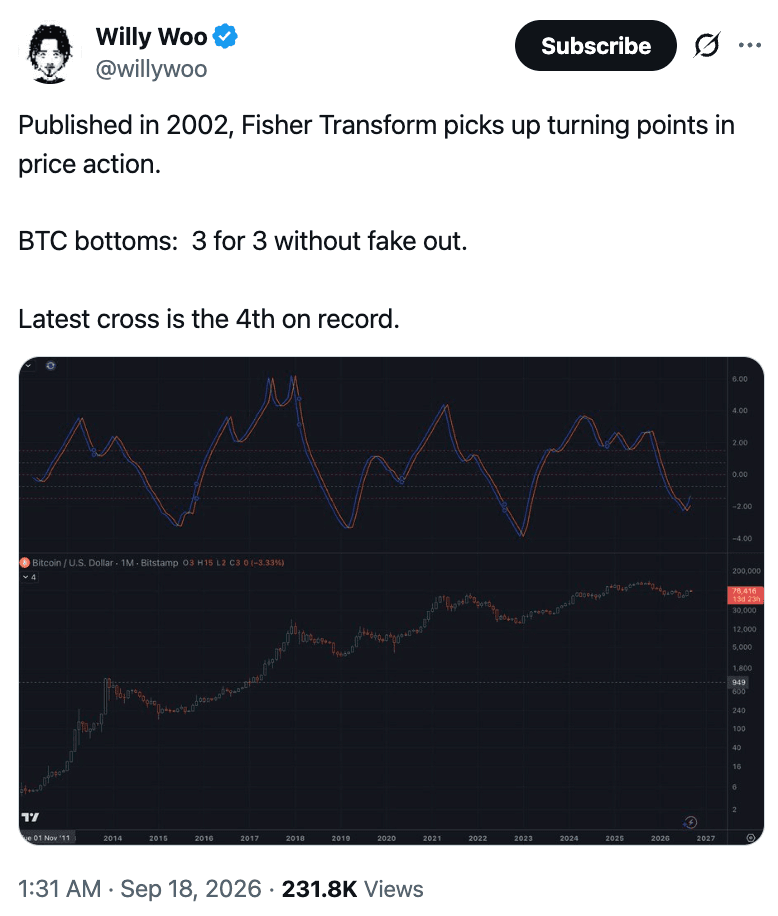
Woo stated that a turning point on the Fisher Transform, a chart tool that indicates prospective price reversals, doesn’t automatically signify the trend is ready to reverse. Price can stop and then resume the same direction, as it has in past bull markets when the signal crossed bearish and eventually turned bullish again, Woo noted in a post on X.
The reason, he added, “is who is trading. Near a cycle top, long-term investors stop buying, but speculators keep piling in, he said, so price keeps increasing on momentum with numerous false turns along the way.
Speculators exit at the bottom and return only when long-term investors find value, Woo added. That allows price to invert more cleanly, making bottoms simpler to spot than peaks. Woo said he prefers to sell in stages rather than trying to hit the top exactly.
Bitcoin’s 17-Year History Is Tiny Compared With Gold’s 5,000 Years
In another post, Woo said Bitcoin had “kept on winning,” even as some early investors viewed it as increasingly “boring”. He contrasted Bitcoin’s 17-year history with gold’s roughly 5000-year track record, saying the asset was still new for conservative investors and sovereigns.

Bitcoin Demand Holds Up Despite Profit-Taking
Glassnode pointed to Bitcoin’s entity-adjusted Spent Output Profit Ratio (SOPR), the metric that measures whether Bitcoin moved on-chain was sold at a profit or a loss relative to its acquisition price. A reading above 1 would indicate that coins were sold at an average profit.
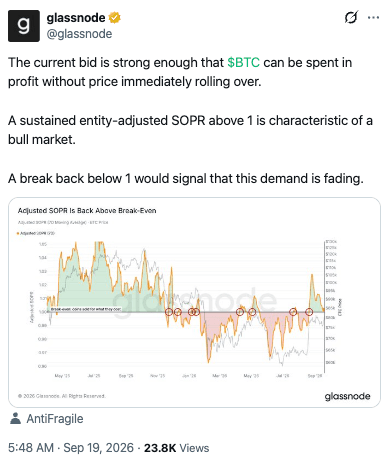
Glassnode said the 7-day average of Bitcoin’s entity-adjusted SOPR has moved back above 1, a sign that buyers are absorbing profit-taking. The firm described sustained readings above that level as a “hallmark of a bull market.” The company added that a drop below 1 could signal a weak demand.
Bitcoin’s Next Resistance Level Sits Near $89,000, Says Analyst
Meanwhile, the analyst named PlanB focused on Bitcoin’s longer-term moving averages (MA). The on-chain analyst said that Bitcoin had closed around $81,000, above its 50-week moving average of about $79,000. “Next target: 100-week MA ($89k),” added the analyst. A MA tracks an asset’s average price over a set period and is commonly used to identify broader price trends.
What Retail Traders Are Saying?
Bitcoin’s price was trading over $81,668, up over 1% over the past 24 hours. On Stocktwits, retail sentiment around Bitcoin remained in ‘bearish’ territory, with ‘low’ chatter levels over the past day.
Bitcoin rose from around $76,000 to above $80,000 on Friday. The move came after the Federal Reserve’s rate hike by a quarter percentage point earlier in the week. A short squeeze also accompanied the rally, with $238 million in Bitcoin short positions liquidated over 24 hours, according to CoinGlass data. Short liquidations occur when traders betting on a price decline are forced out of their positions.
View this Stocktwits post
On Stocktwits, one retail user said that short interest is definitely worth following here. If a position is severely skewed short, a big move upward may cause liquidations and add fuel to the fire.
Read also: Coinbase Files With CFTC To List US Single-Stock Perpetual Futures, Including AAPL And TSLA Contracts
For updates and corrections, email newsroom[at]stocktwits[dot]com.<
Stay updated with all the latest Business NewsShare Market NewsIPOsGold PriceDA Hike8th Pay CommissionAsianet News Official App