Bitcoin's Tightest Range Since September Has Analysts Split On Which Way It Breaks

Synopsis
BTC’s Bollinger Band width narrowed to 4.9% from 11.6% in a week, signaling compression without a clear breakout direction.
- Analyst Axel Adler Jr. identified $86,000 and $81,900 as key levels that could signal Bitcoin’s next move.
- CryptoQuant data showed older Bitcoin holdings becoming more active, though analysts cautioned that movement does not necessarily mean selling.
- Glassnode attributed last week’s selling to futures traders and ETF holders, while US spot Bitcoin ETFs recorded $175.62 million in inflows Tuesday.
Bitcoin (BTC) traded within its tightest range since mid-September on Wednesday as volatility declined and analysts saw mixed signals beneath the surface.
The Bollinger Bands tightened, offering no clear indication of the next move, but renewed activity among longer-term holders and the return of spot Bitcoin Exchange-Traded Fund (ETF) inflows suggested the market could be nearing a turning point.
Bitcoin’s Volatility Squeeze Leaves $81,900–$86,000 Range in Focus
Analyst Axel Adler Jr. said the squeeze itself pointed nowhere. "Narrow bands indicate market compression, but they do not reveal the direction or timing of the next move," he wrote in his morning brief.

Adler tracked the squeeze using “Bollinger Bands,” which measure how far price swings around its recent average. Bandwidth fell to 4.9% of the average price on Tuesday, from 11.6% a week earlier. Bitcoin also slipped to about $83,200 from $85,800 over that stretch, Adler Jr. said.
He put the top of the range at $86,000 and the bottom at $81,900. A hold above the top would signal an upward move, the analyst explained, while a hold below the bottom would point lower.
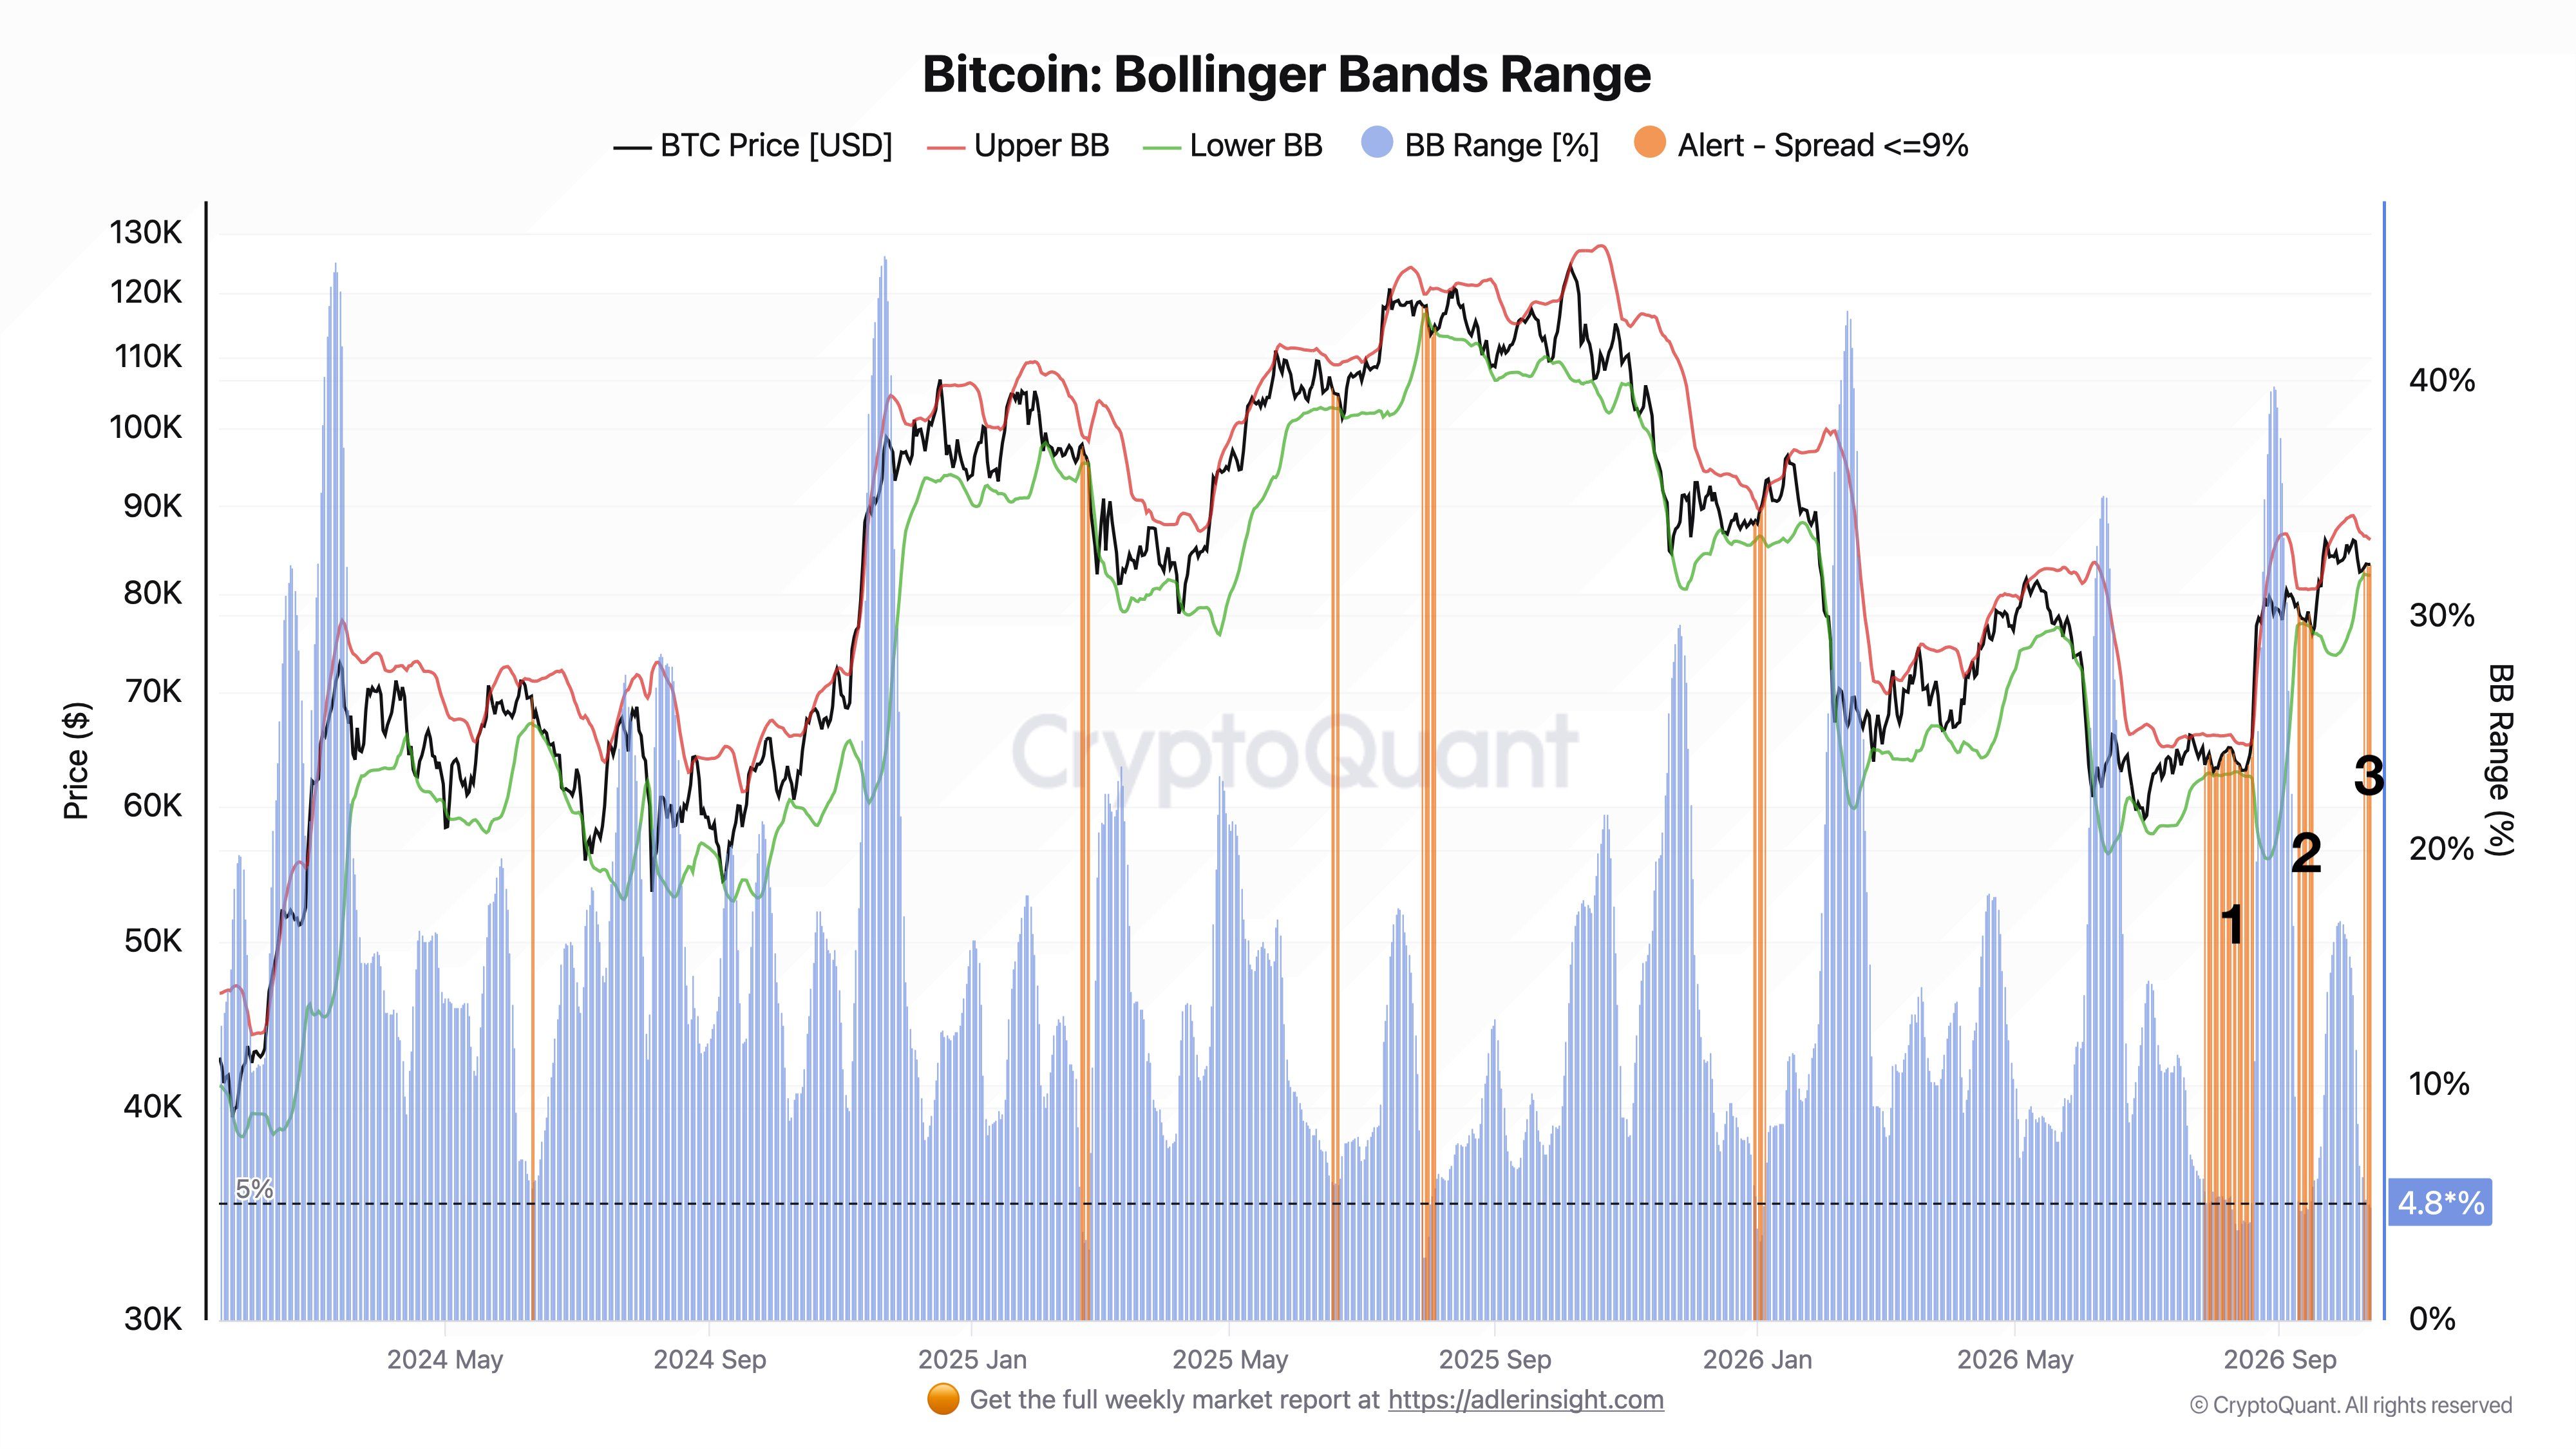
Adler's Volatility and Flow Index also showed a cooler market. It stood at 1,768, below its one-year average of 1,828. The index combined price swings, exchange flows, and the balance of market buys and sells.
Bitcoin’s price fell only 0.2% over the past 24 hours trading above $83,000. On Stocktwits, retail sentiment around BTC remained in the ‘bearish’ zone, while chatter stayed at ‘low’ levels over the past day.
Older Coins Tell A Different Story
A CryptoQuant analyst saw more activity underneath. Coins held for one to three years, and for more than three years, became more active in late September, the analyst said. That came as Bitcoin climbed from the mid-$70,000s to the mid-$80,000s. The analyst said similar spikes appeared in January and February, and again from late July to mid-August. "Movement doesn't necessarily mean selling or profit-taking," according to a CryptoQuant contributor.
The Ledger security incident could add to it. The analyst said it prompted users to move funds to a new Ledger signer with a new recovery phrase, which "might amplify this movement over the coming days."
What Drove Last Week's Dip
Glassnode’s latest weekly report showed who sold last week. Perpetual futures traders and ETF holders led the selling, according to Glassnode. U.S. spot Bitcoin ETFs saw net outflows of about $681.1 million last week, according to SoSoValue data.
ETF buyers returned on Tuesday, however. The funds took in $175.62 million, their largest daily inflow since October 2, after $65.40 million in outflows on Monday.
Options traders bought protection. The 25-delta skew, which compares the cost of bets on a fall against bets on a rise, more than doubled to 4.46% from 2.1%. Other signs of new money held up too.
Glassnode said the monthly change in realized capitalization, a measure of capital held in Bitcoin, rose to 1.2% from 1.1%. More than 70% of supply remained in profit.
The squeeze followed a rebound led by spot buyers this week.
Read also: Coinbase Warns Bitcoin Faces Quantum Threat, Flags Satoshi-Era Coins As A Separate Challenge
For updates and corrections, email newsroom[at]stocktwits[dot]com.<
Stay updated with all the latest Business NewsShare Market NewsIPOsGold PriceDA Hike8th Pay CommissionAsianet News Official App